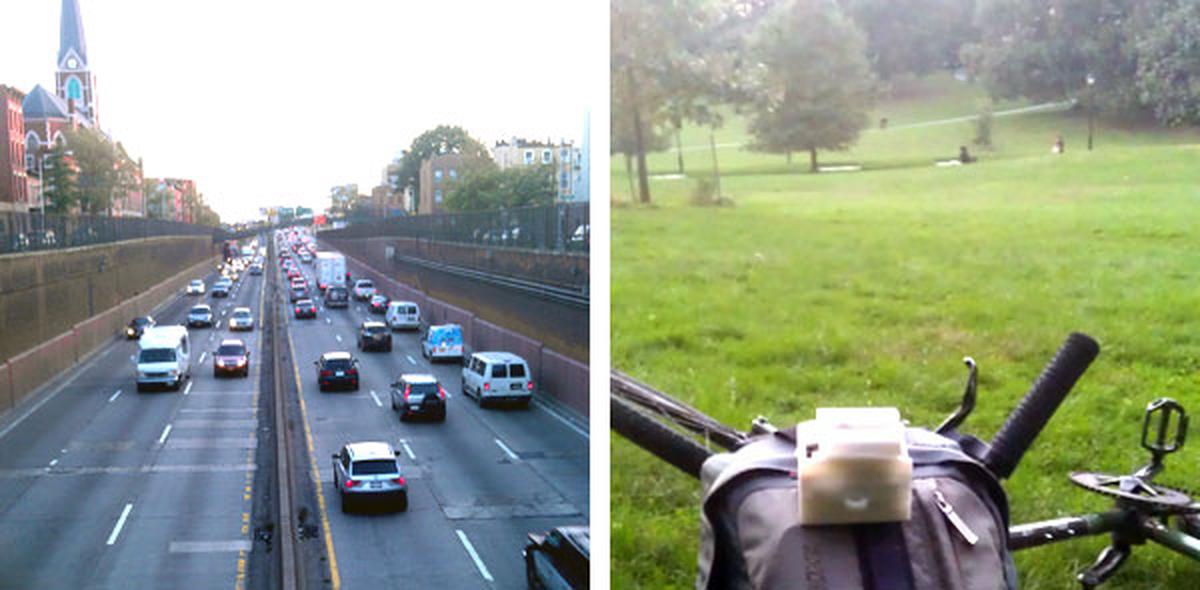
This evening I clipped an AirCasting Air Monitor to my backpack, strapped a Zephyr heart rate monitor to my chest, and set out to find a good place to measure bad air. Conjecturing that car and truck exhaust might accumulate in the area where the Brooklyn-Queens Expressway dips below street level before barreling into the Gowanus Expressway, I grabbed my bike and headed for the intersection of Union Street and the BQE. I was curious to find out whether my air monitor would confirm my hypothesis: that the air around this stretch of the BQE had more carbon monoxide (CO) and nitrogen dioxide (NO2) than the air in the middle of Prospect Park. I was also interested to see if the monitor would register any changes in humidity or temperature as I moved from city streets into the park. And the heart rate monitor was just for fun. I wanted to see how the “slope” in park slope might kick my ticker. (Note that I lost my GPS fix as I cycled through the southern end of the park loop. These readings then got marked as having been recorded at 8th Ave. and 3rd St. Dang GPS!)
Looking at the CO and NO2 maps and graphs from my ride, observe that the readings don’t budge much. At this point we’re not at all sure how to interpret the readings from these low-cost metal-oxide semiconductor gas sensors. There’s a laundry list of complicating factors (detection limits, range limits, response time, hysteresis, cross-sensitivity, relative-humidity effects, temperature effects, aging, air flow characteristics, saturation effects, poisoning) that make it extremely difficult to characterize their sensitivity and accuracy. That’s why we have the air monitor reporting measurements using a generic response indicator (RI) unit rather than parts per million (ppm) or parts per billion (ppb).
So why were the measurements mostly static? Maybe because the concentration of these gases is in fact relatively stable across the area that was surveyed. Or maybe because the ppm or ppb range represented by one unit on the RI scale is very large, e.g. a change in 1 RI unit might correspond to a change in 30 ppb NO2. Or maybe . . . well there are a lot of potential maybes. Bottom line is we’re not sure what’s happening but we’re on the road to find out.
In the coming months we’ll be setting up a mini-lab in partnership with the New York Hall of Science and the New York City College of Technology to run some basic tests on the gas sensors. We think we can improve the accuracy of the gas sensors by calibrating them against known gas concentrations and higher-end instruments. We’ve also let the EPA borrow one of our air monitors to run through a battery of tests at their high-tech lab in Research Triangle Park and are looking forward to using the results of their study to further improve the air monitor.
Whereas were not sure what’s happening with the gas sensors, we’re more confident in the accuracy of the temperature and relative humidity sensors on board the air monitor. The temperature and relative humidity sensors are affected (rising temperature and declining relative humidity) by the heat generated fom the operation of the air monitor electronics. However, this didn’t seem to be a problem tonight; probably because moving fast while cycling improves air flow through the device or maybe under cooler conditions the intensity of the heating is less pronounced.
Looking at the temperature and humidity maps and graphs, you can see that the urban heat island effect is in effect. Outside the park the temperature averages 66 degrees whereas inside the park it averages around 63. And you can see the temperature start to drop immediately upon entering the park. Relative humidity moves in the opposite direction, climbing when I enter the park and peaking as I ride through the forested section of the park between E. Lake Drive and my stopping point in Long Meadow.
As for my heart rate, it spiked when I first started out, spiked again every time I rested (like when I got stopped by a red light at 4th Avenue and again when I stopped pedaling while riding down the beginning of the hill in the park) and then spiked again pedaling up the steep hill through the woods at the end of my ride (this is hard to see because I lost my GPS fix again going through the woods).
All in all a good ride and a great AirCasting session.