Hardware Specifications
Weight: 7 ounces
Particle Sensor: Shinyei PPD60PV
Temperature & Relative Humidity Sensor: MaxDetect RH03
Bluetooth: Nova MDCS42, Version 2.1+EDR
Microcontroller: Atmel ATmega32U4
Bootloader: Arduino Leonardo
About the AirBeam
HabitatMap worked with a community of scientists, educators, engineers, and other non-profits to create the AirBeam. The AirBeam measures fine particulate matter (PM2.5), temperature, and relative humidity. The AirBeam uses a light scattering method to measure PM2.5. Air is drawn through a sensing chamber wherein light from an LED bulb scatters off particles in the airstream. This light scatter is registered by a detector and converted into a measurement that estimates the number of particles in the air. Via Bluetooth, these measurements are communicated approximately once a second to the AirCasting Android app, which maps and graphs the data in real time on your smartphone. At the end of each AirCasting session, the collected data is sent to the AirCasting website, where the data is crowdsourced with data from other AirCasters to generate heat maps indicating where PM2.5 concentrations are highest and lowest. As an open-source platform, modifying our components to take other measurements and or transmit the data to other websites or apps is easy and encouraged. We’ve even included Add-on Sensor Pins on the AirBeam to make adding sensors simple.
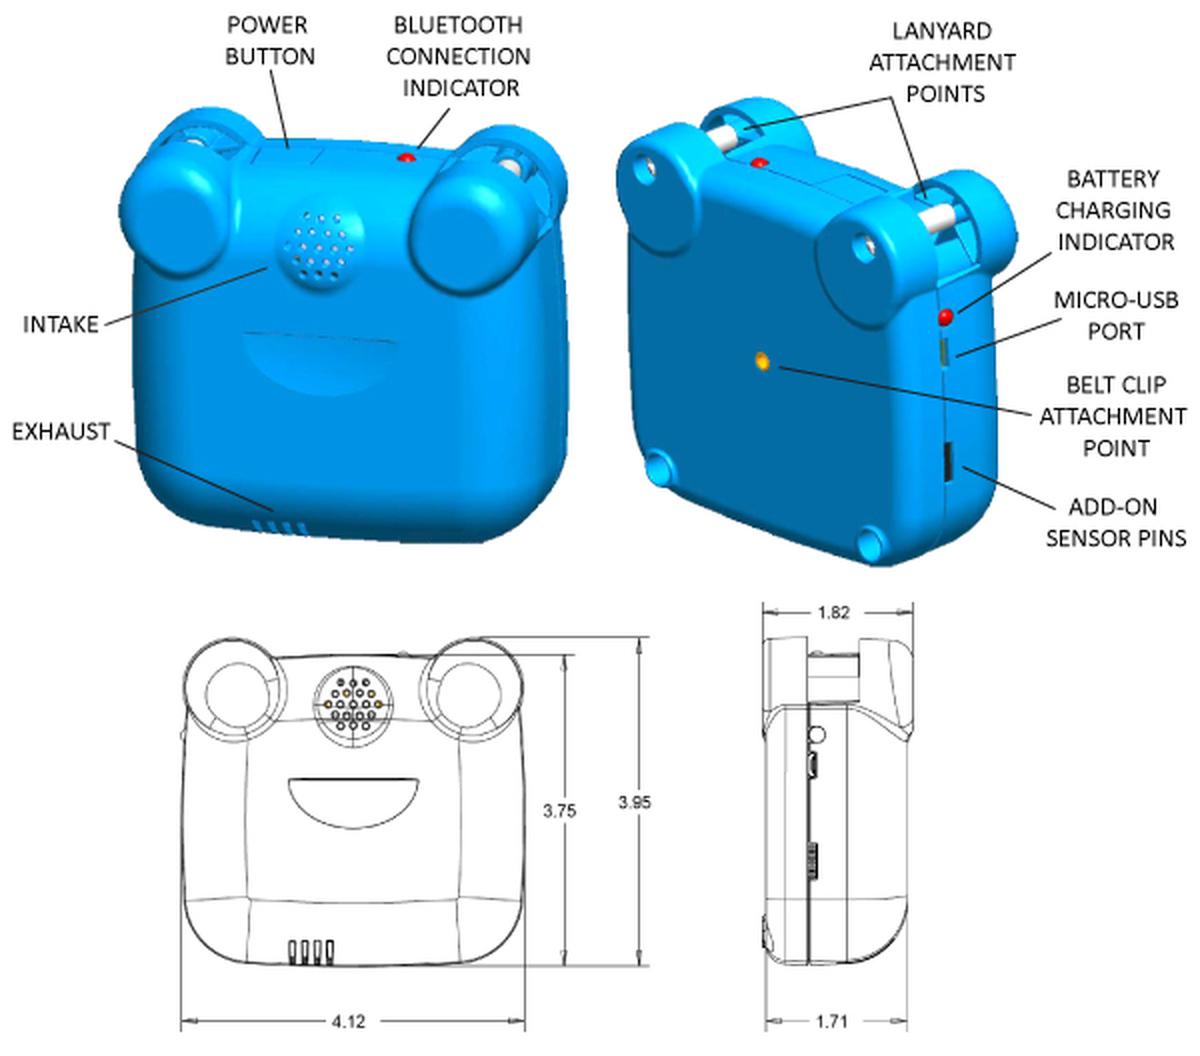
Power
The AirBeam has a 2000 mAh 3.7V rechargeable lithium battery. When the battery is fully charged, the AirBeam can operate for 10 hours. The battery charges via the micro-USB port, which can also be used to power the AirBeam directly. The Battery Charging Indicator turns solid green when the AirBeam is charging and turns off when the AirBeam is either fully charged or unplugged.
Power On/Off
To power on the AirBeam, press down on the Power Button. The AirBeam is on when the Bluetooth Connection Indicator blinks red. Push the Power Button a second time to power off the AirBeam.
Intake & Exhaust
While operating the AirBeam, be sure to keep the Intake and Exhaust free from obstructions.
Connect the AirBeam to the AirCasting Android App
Download the AirCasting app from the Google Play Store. Launch the app, then navigate: "External devices" > "Pair with new devices" > "Search for Devices" > pair with the device labeled "AirBeam . . . " (note that you only need to pair once) > return button > press "AirBeam . . . ". The AirBeam is connected to the AirCasting Android app via Bluetooth when the Bluetooth Connection Indicator is solid red and the AirBeam sensor streams appear on the AirCasting App Sensors Dashboard.
Acquire AirBeam Data via Serial Monitor
You can acquire the AirBeam data via the Micro-USB Port or Bluetooth using a serial monitor.
Programming
The AirBeam board is based on the Arduino Leonardo, so you can reprogram your AirBeam using the Arduino IDE.
Add Another Sensor
You can add another sensor to the AirBeam using the Add-on Sensor Port. When the AirBeam is resting on it’s back the five pins, from left to right, are: Ground, 5V, 3.3V, Analog 2, Analog 1. Note that you must insert a tiny screwdriver into the slot above the pin to release the pin.
Open Source
The AirBeam firmware and electronic schematics are available on GitHub. The STL files for 3D printing the AirBeam enclosure can be downloaded from Shapeways.
FCC Compliance Statement
This device complies with part 15 of the FCC Rules. Operating is subject to the following two conditions: (1) This device may not cause harmful interference, and (2) this device must accept any interference received, including interference that may cause undesired operation. Caution: Modifying or tampering with internal components can cause a malfunction and will void FCC authorization to use these products.
This equipment has been tested and found to comply with the limits for a Class B digital device, pursuant to Part 15 of the FCC Rules. These limits are designed to provide reasonable protection against harmful interference in a residential installation. This equipment generates, uses, and can radiate radio frequency energy and, if not installed and used in accordance with the manufacturer’s instructions, may cause interference harmful to radio communications. There is no guarantee, however, that interference will not occur in a particular installation. If this equipment does cause harmful interference to radio or television reception, which can be determined by turning the equipment off and on, the user is encouraged to try to correct the interference by one or more of the following measures: reorient or relocate the receiving antenna; increase the separation between the equipment and receiver; connect the equipment to an outlet on a circuit different from that to which the receiver is connected; and/or consult the dealer or an experienced radio or TV technician for help.
Performance Data
The below claims and disclaimers are based on comparisons between the AirBeam, a Thermo Scientific pDR-1500 with a PM2.5 cut-point inlet, and teflon filter samples subjected to gravimetric analysis. The pDR-1500 is a $5,000, 2.5 lb air quality monitor frequently used by government and academic researchers to evaluate personal exposure to fine particulate matter or PM2.5. Teflon filter samples were taken with a Leland Legacy 10L pump and PM2.5 cut-point inlet and weighed at the NYU School of Medicine’s filter weighing room, which meets EPA guidelines for filter conditioning, storage, and gravimetric measurement of PM2.5 and PM10 filters. Filters subjected to gravimetric analysis are the “gold standard” for measuring PM2.5. Additional research is required to fully characterize the performance of the AirBeam and we look forward to working with the AirCasting community to “fill in the gaps”.
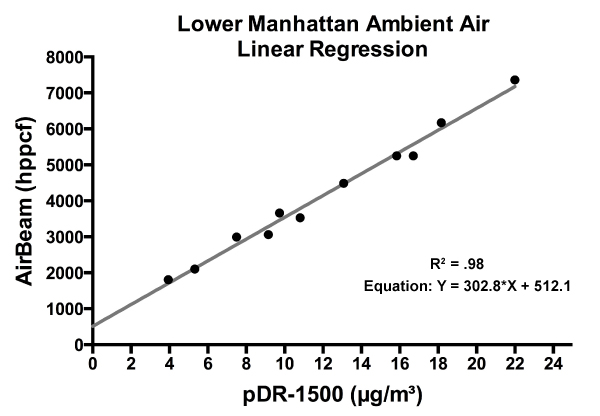
When presenting our performance data on the AirBeam below, we include R2 or R-squared values to indicate how the AirBeam compares with other methods for measuring PM2.5. R2 is a statistical measure that indicates how well data fit a statistical model, in this case, the prediction of the Y-axis (AirBeam) from the X-axis (pDR-1500) using a linear (straight) or nonlinear (curved) line. The R2 value is a fraction that ranges from 0.0 to 1.0 with higher values indicating that the regression came more closely to the points. An R2 value of 1.0 means that the predictive power of the model is perfect, that all the points lie along the line or curve with no scatter.
Below 100 micrograms per cubic meter (µg/m³), samples collected in ambient air in Manhattan (samples were collected on 11 different occasions and averaged over 12 hour periods) and while burning cardboard indoors (samples were collected over a 1 hour period and averaged every minute) both showed a strong linear relationship between the AirBeam and pDR-1500 measurements. As illustrated in Figure 1, the R2 values below 24 µg/m³ for two AirBeams in ambient air in Manhattan were .98 or better.
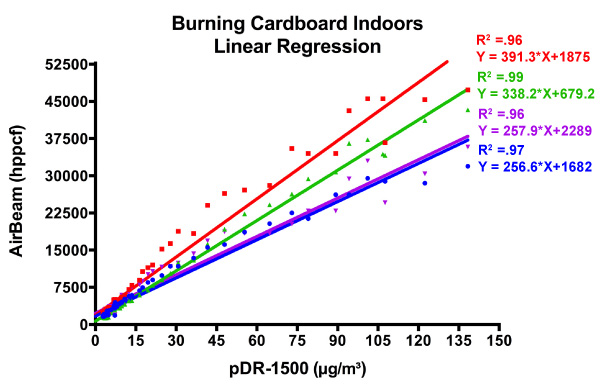
As illustrated in Figure 2, the R2 values below 100 µg/m³ for four AirBeams while burning cardboard indoors were .94 or better. Also shown in Figure 2, “out-of-the-box” variability between AirBeams is more pronounced as the measurements climb above 30 µg/m³. Meaning that measurements recorded by two AirBeams exposed to identical air samples may begin to drift apart as PM2.5 concentrations increase. Out-of-the-box variability can be substantially reduced by using the AirCasting app calibration feature (still in beta) and adjusting the side-facing potentiometer on the Shinyei PPD60PV.
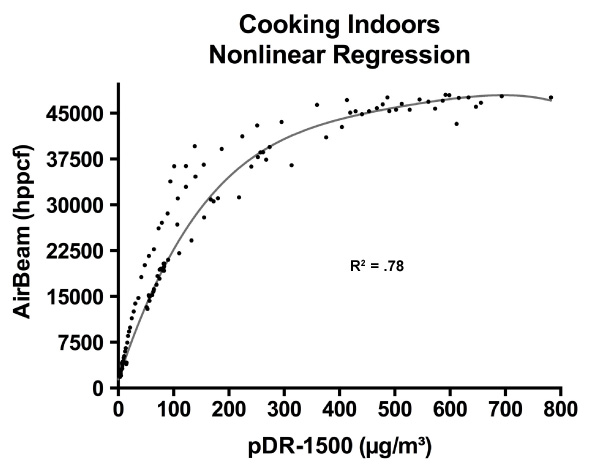
Because the relationship between the AirBeam and pDR-1500 measurements becomes increasingly non-linear above 100 µg/m³, a nonlinear regression curve was used to determine the relationship between the AirBeam and pDR-1500 measurements at higher concentrations, see Figure 3 (samples were collected over a 1 hour period and averaged every minute). During separate sampling runs, we calculated R2 values for the nonlinear regression curve ranging from 0.60 to 0.80. The decrease in R2 values as compared to the linear regression is likely attributed to higher variability near and above the AirBeam’s maximum limit of detection, which we estimate to be approximately 400 µg/m³.
Additional research is required to see how the maximum limit of detection is impacted by the reflectivity of the aerosol being sampled. The relative reflectivity of aerosols impacts the AirBeam measurements. Highly reflective aerosols, like wood smoke, bias the AirBeam measurements upwards, whereas less reflective aerosols, like diesel exhaust, bias the AirBeam measurements downwards.
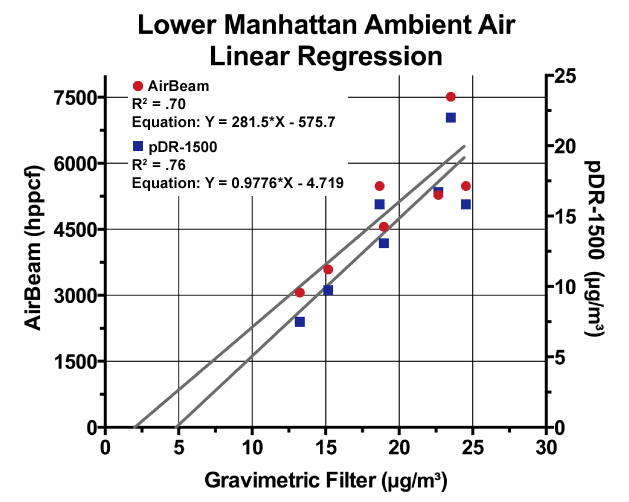
During ambient air sampling in Lower Manhattan during the summer months, measurements from a pDR-1500 and two Airbeams were compared against a teflon filter subjected to gravimetric analysis, see Figure 4. Sampling was done in 12-hour averages each day for 11 days and averaged to compare the real time instruments against the gravimetric filters. When compared against the gravimetric filters, the R2 value of AirBeams was found to be 0.70 compared to 0.76 for the pDR-1500. Time weighted averages of the gravimetric filter data showed consistently higher values as compared to the pDR-1500 at ambient levels. We assume this downward bias is also in effect with the AirBeam, since both are light scattering particle counters. Further, we assume part of this this bias can be attributed to the relative reflectivity of the aerosol being measured. The R2 value of the pDR-1500 measured against the AirBeams during these 12-hour day averages was found to be 0.98.
Research conducted by others on light scattering particle counters indicates that high relative humidity (>80%) is likely to have a negative impact on the accuracy of the AirBeam. When relative humidity is high, aerosols take on water becoming more reflective. Additional research is required to better characterize this effect as it applies to the AirBeam.
AirBeam performance data collection, analysis, and findings are the work of Alex Besser and Michael Heimbinder. Alex is a graduate student in Environmental Toxicology at New York University. Michael is the Founder and Executive Director of HabitatMap and AirBeam Lead Developer. Dr. George Thurston, Alex's academic adviser and professor of Environmental Medicine at New York University School of Medicine, provided the material resources and guidance that made this research possible.