Hardware Specifications
Weight: 5 ounces
Particle Sensor: Plantower PMS7003
Relative Humidity Sensor: Honeywell HIH-5030-001
Temperature Sensor: Microchip MCP9700T-E/TT
Bluetooth: Nova MDCS42, Version 2.1+EDR
WiFi: Espressif ESP8266-ESP-12S, 2.4 GHz
Cellular: SIMCOM SIM808, 2G GSM
Microcontroller: Teensy++
About AirBeam2
AirBeam2 measures fine particulate matter (PM1, PM2.5 & PM10), temperature, and relative humidity. AirBeam2 uses a light scattering method to measure particulate matter. Air is drawn through a sensing chamber wherein light from a laser scatters off particles in the airstream. This light scatter is registered by a detector and converted into a measurement that estimates the number of particles in the air. When recording a mobile session, these measurements are communicated once a second to the AirCasting Android app via Bluetooth. When recording a fixed session, these measurements are communicated once a minute to the AirCasting website via WiFi or cellular. At the end of each mobile AirCasting session, the collected data is sent to the AirCasting website, where the data is crowdsourced with data from other AirCasters to generate heat maps indicating where PM concentrations are highest and lowest.
Charging
Fully charge your AirBeam2 before powering it on and using it in WiFi or Cellular mode or the AirBeam2 may lose power (even it it’s plugged in).
Power
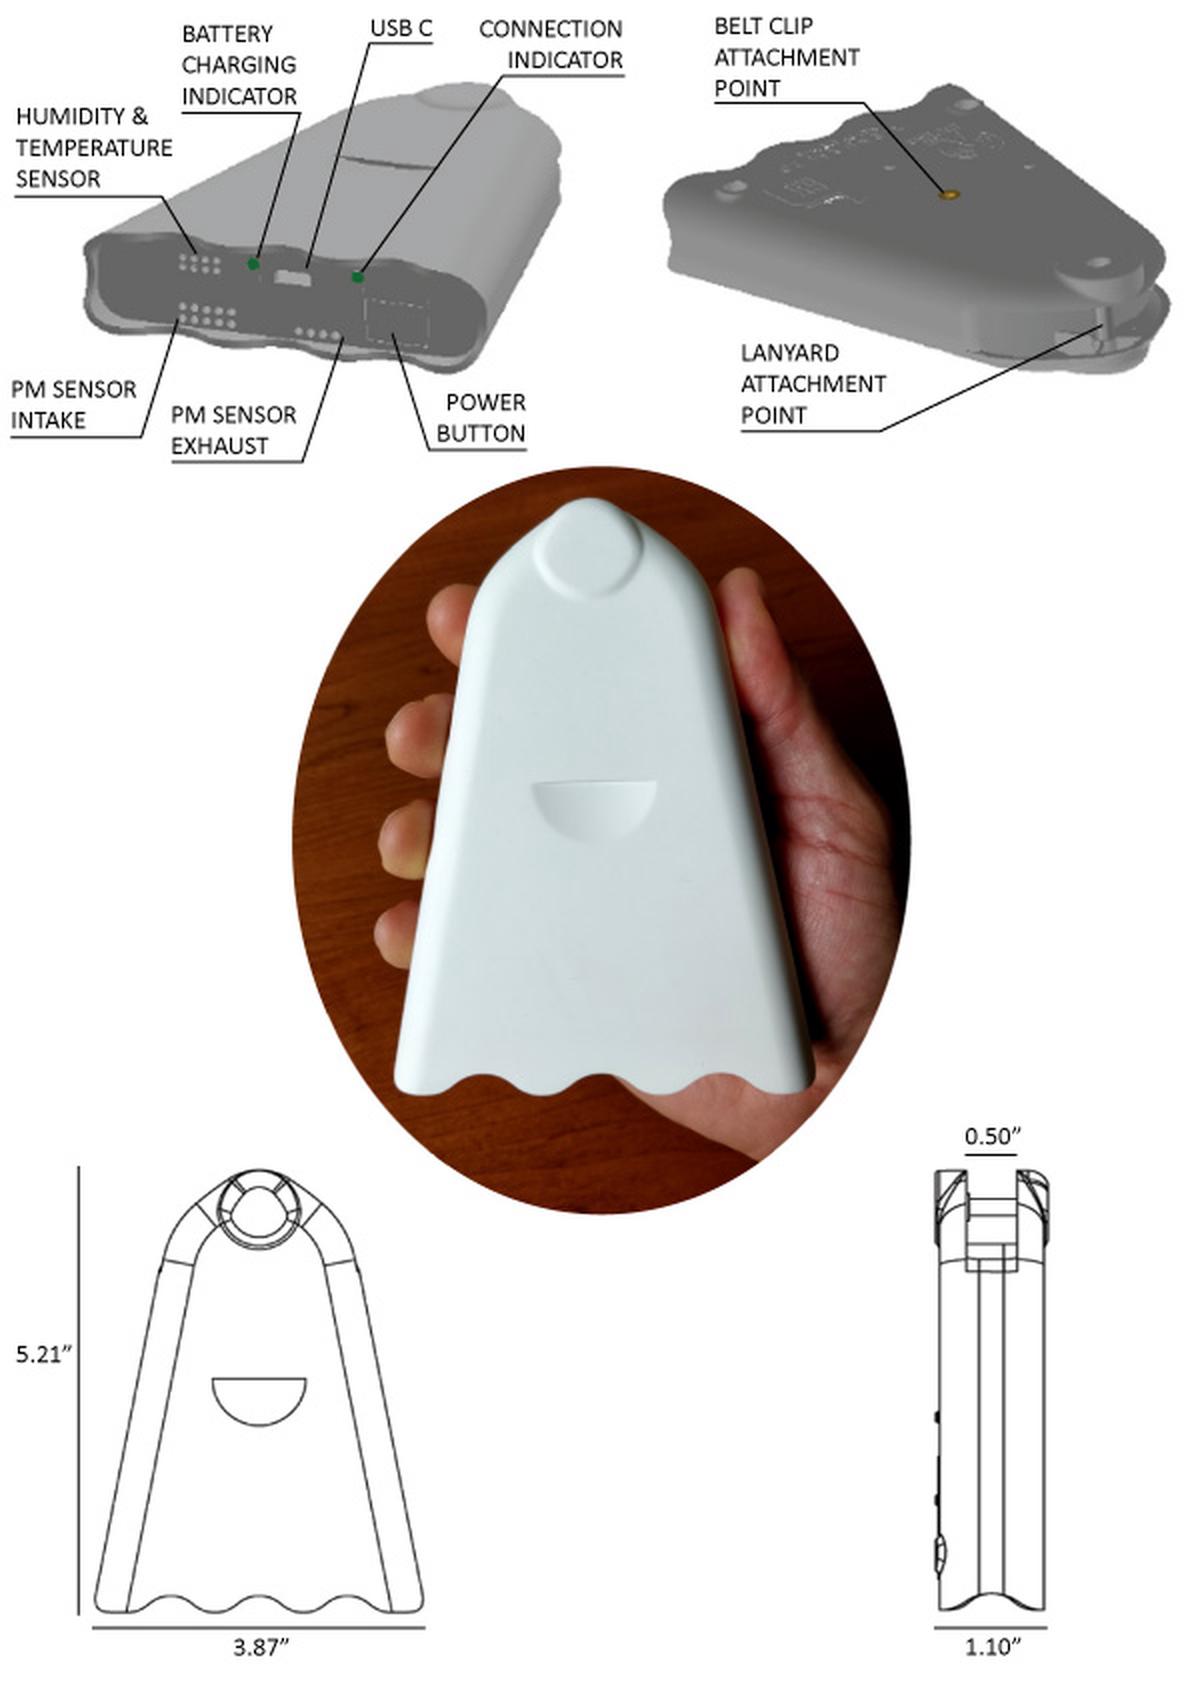
AirBeam2 has a 2000 mAh 3.7V rechargeable lithium battery that can power the instrument for 10 hours when fully charged. The battery charges via the USB-C Port, which can also be used to power the AirBeam2 directly. The Battery Charging Indicator turns solid green when the AirBeam2 is charging and turns off when the AirBeam2 is either fully charged or unplugged.
Power On/Off
To power on the AirBeam2, press down on the Power Button. The AirBeam2 is on when the Connection Indicator lights up. Push the Power Button a second time to power off the AirBeam2.
Intake & Exhaust
While operating the AirBeam2, keep the Intake and Exhaust free from obstructions
Record Measurements - Mobile (Bluetooth) Session
1) Download the AirCasting app from the Google Play store.
2) Turn on the AirBeam2.
3) Via the Android device "Settings", pair the AirBeam2 to the Android device.
4) Turn off the AirBeam2.
5) Launch the AirCasting app.
6) Turn on the AirBeam2.
7) When the AirBeam2 "Connection Indicator" turns from red to green > press "Configure AirBeam2" > press "connect" > press "Mobile"; wait 5 seconds and the AirBeam2 sensor streams will appear on the Dashboard.
8) Press the "record" button in the upper right hand corner, enter a “Title” and “Tags” (neither are required), and press “Start Session”.
When recording a mobile session, measurements are communicated once a second to the AirCasting Android app via Bluetooth. The Android device must stay within 10-20 feet of the AirBeam2 to maintain the Bluetooth connection and receive data from the AirBeam2.
Record Measurements - Fixed (WiFi) Session
1) Download the AirCasting app from the Google Play store.
2) Turn on the AirBeam2.
3) Via the Android device "Settings", pair the AirBeam2 to the Android device.
4) Turn off the AirBeam2.
5) Launch the AirCasting app.
6) Turn on the AirBeam2.
7) When the AirBeam2 "Connection Indicator" turns from red to green > press "Configure AirBeam2" > press "connect" > press "Fixed" > press “WiFi” > enter the “WiFi Network Name” and “WiFi Password” and press “Submit” > enter a “Title” and “Tags” (neither are required) and press either “Start Indoor Session” or “Start Outdoor Session > if you selected “Start Outdoor Session”, then set the location. (Note that the AirBeam2 must be connected to the 2.4 GHz band of your WiFi network, it cannot connect via the 5 GHz band).
8) The Dashboard will read “Retrieving streams, please wait”; wait 2-3 minutes and the AirBeam2 sensor streams will appear on the Dashboard.
When recording a fixed WiFi session, the measurements are communicated once a minute to the AirCasting website via WiFi. The Android device no longer needs to be in proximity to the AirBeam2 as it’s retrieving the data from the web via the Android device’s WiFi or cellular connection.
Record Measurements - Fixed (Cellular) Session
1) Unscrew the AirBeam2 enclosure, pull out the circuit board, carefully push down and lift the SIM card slot, insert the SIM card into the SIM card slot, close the SIM card slot, place the circuit board back inside the enclosure, and screw the AirBeam2 together again. (AirBeam2 data and messaging costs are approximately $25 per month when using a Ting SIM card. Note that 2G cellular service is not available in all locations.)
2) Download the AirCasting app from the Google Play store.
3) Turn on the AirBeam2.
4) Via the Android device "Settings", pair the AirBeam2 to the Android device.
5) Turn off the AirBeam2.
6) Launch the AirCasting app.
7) Turn on the AirBeam2.
8) When the AirBeam2 "Connection Indicator" turns from red to green > press "Configure AirBeam2" > press "connect" > press "Fixed" > press “Cellular” > enter a “Title” and “Tags” (neither are required) and press either “Start Indoor Session” or “Start Outdoor Session > if you selected “Start Outdoor Session”, then set the location.
9) The Dashboard will read “Retrieving streams, please wait”; wait 2-3 minutes and the AirBeam2 sensor streams will appear on the Dashboard.
When recording a fixed cellular session, the measurements are communicated once a minute to the AirCasting website via the cellular network. The Android device no longer needs to be in proximity to the AirBeam2 as it’s retrieving the data from the web via the Android device’s WiFi or cellular connection.
Connection Indicator
When first powered on, the AirBeam2 Connection Indicator will shine red for ten seconds to indicate the AirBeam2 is performing a system check. During the next fifty seconds, the Connection Indicator will shine green to indicate the AirBeam2 is in configuration mode. Once configuration is begun, the configuration window will remain open until configuration is complete. If configuration is not initiated within the fifty-second window, AirBeam2 will load the last know configuration. To reopen the configuration window, power your AirBeam2 off/on.
When AirBeam2 is configured for a mobile recording session, the AirCasting app will connect to the AirBeam2 via Bluetooth and the Connection Indicator will shine solid white for 2 minutes. If the AirBeam2 is disconnected while in mobile mode, the Connection Indicator will blink red. When AirBeam2 is configured for a fixed recording session, the Connection Indicator will shine blue while acquiring the time and date and then shine white for 2 minutes while AirBeam2 begins taking measurements and sending data to the AirCasting website.
As the community of AirCasters grows, we look forward to learning more about how AirBeam2 performs under various weather conditions and shelter configurations. Please get in touch and share your experiences AirCasting outdoors so we can update this section with more comprehensive information.
Temperature & Humidity Measurements
AirBeam2 measures the temperature and relative humidity inside the AirBeam2 enclosure. These measurements are not representative of the ambient temperature and relative humidity.
Acquire AirBeam2 Data via Serial Monitor
You can acquire the AirBeam2 data via the USB-C Port using a serial monitor.
Programming
The AirBeam2 board is based on the Teensy++, so you can reprogram your AirBeam using the Arduino IDE.
Open Source
The AirBeam2 firmware and electronic schematics are available on GitHub. The STL files for 3D printing the AirBeam enclosure can be downloaded from Shapeways.
FCC Compliance Statement
This device complies with part 15 of the FCC Rules. Operating is subject to the following two conditions: (1) This device may not cause harmful interference, and (2) this device must accept any interference received, including interference that may cause undesired operation. Caution: Modifying or tampering with internal components can cause a malfunction and will void FCC authorization to use these products.
Performance Data
When presenting our AirBeam2 performance data below, we include R-squared (R2) values as a way of evaluating intercomparisons between instruments that measure particulate matter. R2 is a statistical measure that indicates how well data fit a statistical model. The R2 value is a number that ranges from 0 to 1 with higher values indicating the regression came more closely to the points. An R2 value of 1 means the predictive power of the model is perfect, that all the data points lie along the line or curve with no scatter.
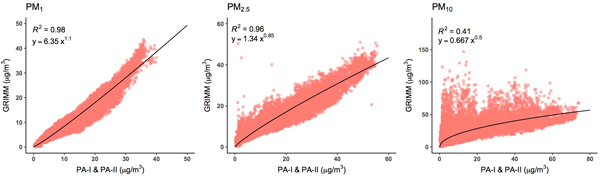
To begin, we analyzed data provided by South Coast Air Quality Management District (SCAQMD) comparing the performance of PurpleAir-I (PA-I) and PurpleAir-II (PA-II) air quality instruments to a GRIMM EDM180, a Federal Equivalent Method air quality instrument. PA-I integrates a Plantower PMS1003 sensor and PA-II integrates a Plantower PMS5003 sensor. Although these sensors are not identical to the Plantower PMS7003 sensor integrated into the AirBeam2, discussions with SCAQMD staff led us to believe that performance variations between Plantower particulate sensor models were small.
Using five-minute averages, we fit equations for PM1, PM2.5, and PM10 that converted the PurpleAir measurements to the GRIMM measurements, see below plots. After removing significant outliers, our dataset included 17,270 data points. The equations for PM1, R2=0.98, and PM2.5, R2=0.96, showed excellent fit, with a suggestion of an exponential response for the PM1 equation. For the PM10 equation, R2=0.41, the fit was average, with especially imprecise measurements in the lower concentration ranges.
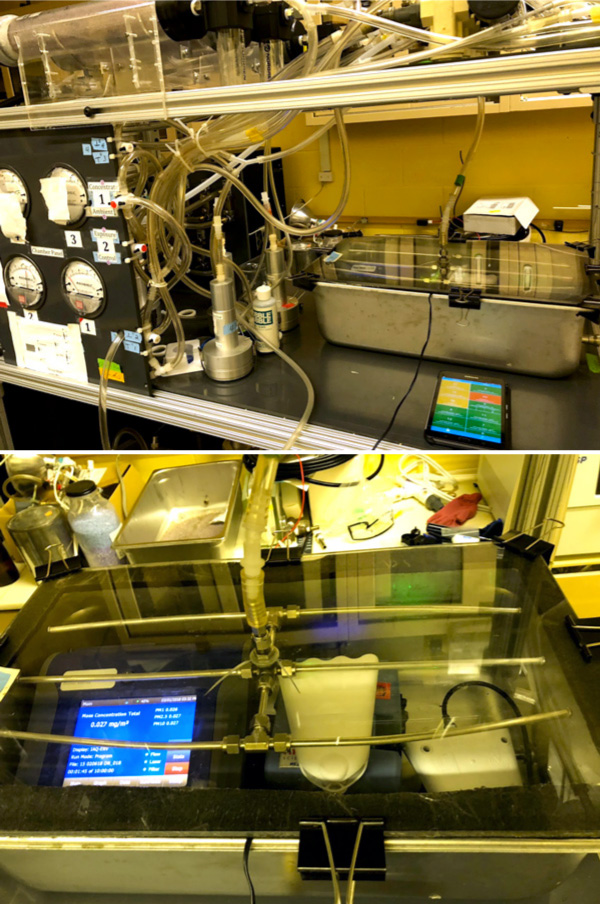
Next, we updated the AirBeam2 firmware to run the calibration equations we derived from fitting the PurpleAir measurements to the GRIMM measurements. Then we validated our calibration equations by comparing the AirBeam2 measurements to the measurements from a TSI DustTrak DRX Aerosol Monitor 8533. Two AirBeam2s and one TSI were placed inside a concentrated air pollutants (CAPS) chamber located at the NYU School of Medicine Sterling Forest campus. The CAPS chamber is designed for animal exposure tests and concentrates outdoor particulate matter into a small sealed enclosure. Unfortunately, we were unable to obtain particle differentiation for PM10 because CAPS removes large particles before concentrating small particles in the exposure chamber.
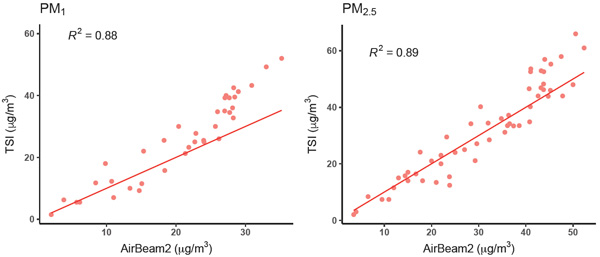
The plots below show one-minute averages from our validation experiment. The results indicate high linearity and excellent agreement between the AirBeam2 and the TSI for both PM2.5, R2=0.89, and PM1, R2=0.88, with the red lines representing what would be perfect agreement between the two instruments.
Our analysis has several limitations. First, to construct the calibration equations we used data that evaluated the performance of earlier model Plantower sensors, which may perform differently than the Plantower sensor integrated into the AirBeam2. Second, we did not have data available for higher concentration ranges, which may potentially ignore non-linearity in responses. Third, we did not adjust for relative humidity or temperature. Prior academic research indicates these variables, especially humidity, can significantly impact the measurements from light scattering sensors. Fourth, we only tested the AirBeam2 against a single aerosol. Given the geographic and seasonal variation in aerosols around the world and the variable response of light scattering sensors to differing aerosol compositions, our results will be more relevant in some settings than others.
We look forward to learning more about AirBeam2 performance as additional evaluations are performed. Please contact us if you undertake an evaluation of the AirBeam2 and generate data that can be publicly shared as we would be happy to disseminate your findings via the AirCasting network.
AirBeam2 performance data collection, analysis, and findings are the work Chris C. Lim, a doctoral student in the Department of Environmental Medicine at NYU School of Medicine. Michael Heimbinder, Executive Director of HabitatMap, directed the analysis and edited the write-up. Dr. George Thurston, Chris’s academic adviser and professor of Environmental Medicine at NYU School of Medicine, provided guidance and access to some of the materials that made this research possible.